Steps
1
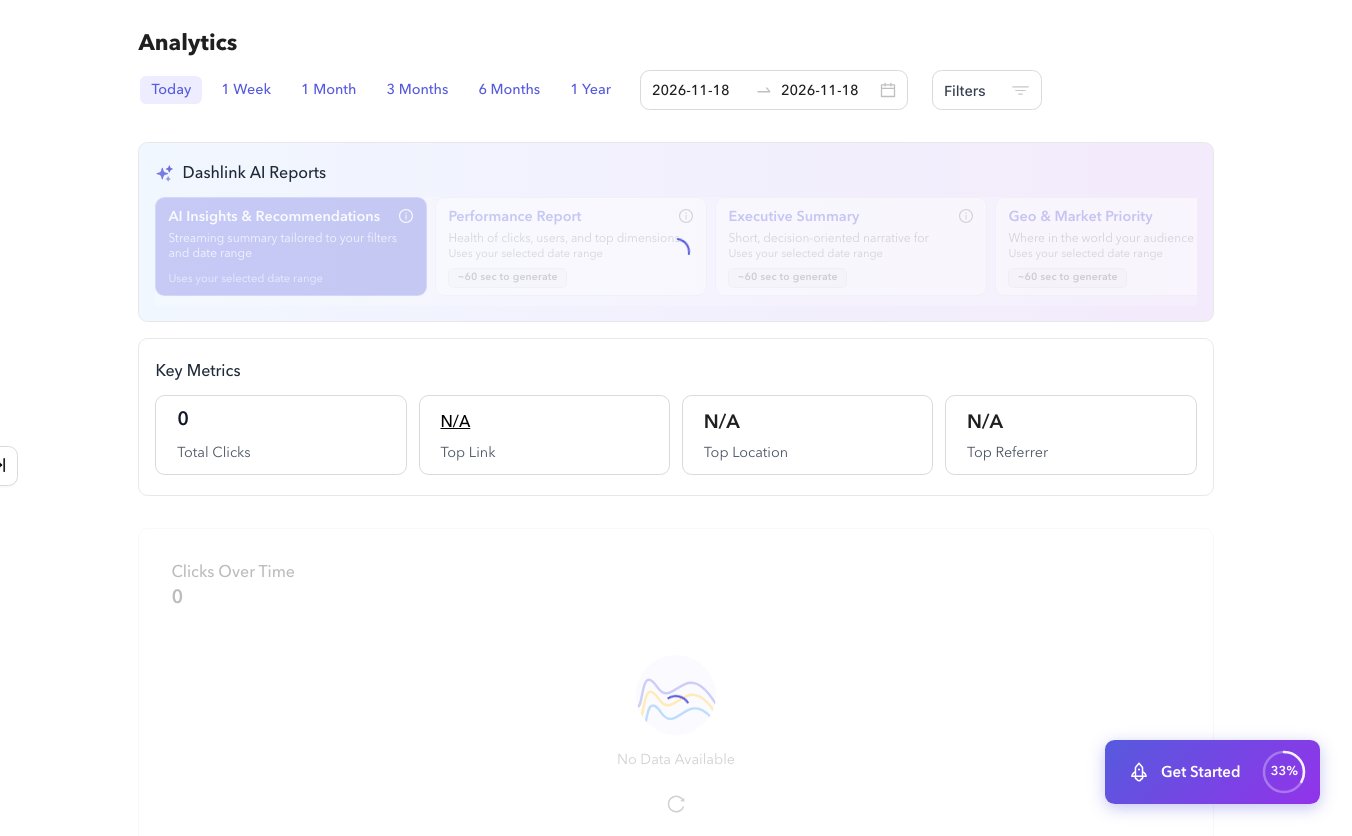
Read the KPI strip
At the top of
/app/analytics, review totals such as clicks, unique visitors, or QR scans for the selected range.2
Explore charts
Use the main time-series and distribution charts. Hover for point detail when available.